How to create your own polar diagram: calibrate the instruments, sail steady sections, filter and bin the data, and use a high percentile for targets.
Photo: John Bell, Unsplash
To create your own polar diagram, you calibrate your speed and wind instruments, sail steady sections across a list of true wind angles in each wind band, filter out unsteady data, group what remains into bins, and take a high percentile of each bin as the target speed. It takes a few days of deliberate sailing and then a season of logging to fill in. The result tells you what your boat actually does, loaded as you sail it, which is more useful than any brochure curve.
Why published polars differ from your boat
A polar from a designer or ORC certificate comes from a velocity prediction program. Those programs assume things that aren't true of a cruising boat on a real day: a clean hull, near-new sails, a racing crew and, typically, smooth water. Your boat carries water, spares and a dinghy on davits, and the genoa has seen some summers. Router software such as LuckGrib suggests starting from a similar boat's polar and scaling it. That's fine for routing, but your own numbers are what show how well you are sailing.
If you want a refresher first, read how to read a polar diagram. The whole method relies on true wind, so if the difference isn't clear, read true vs apparent wind as well.
Preconditions: calibrate first
Every calibration error goes straight into the polar. Spend a calm day on these, with the boat lightly loaded and the sails off where needed.
| Instrument | How to check | What good looks like |
|---|---|---|
| Speed log | Motor a measured distance or a steady GPS track both ways at constant revs, in slack water if possible | Mean of log readings matches mean SOG of both directions |
| Compass | Compare heading with COG at slack water, or line up charted transits, on several headings | Deviation small and known on every heading |
| Wind angle | Motor head to wind in flat water, then sail close-hauled on each tack | Apparent angle reads zero head to wind, equal on both tacks |
| Wind speed | Compare true wind on a beat and a run in steady wind | True wind about equal on both |
For the speed log, running both ways cancels the current. In an example at constant revs, the log reads 6.6 knots each way, and SOG is 7.1 one way and 5.7 the other. The mean SOG is 6.4, so the correction factor is 6.4 divided by 6.6, or about 0.97. Without that correction every speed in your polar would be about 3 percent too high.
For wind angle, if the true wind direction jumps every time you tack, your angle sensor has an offset or the boat's leeway isn't being handled. A consistent swing to one side usually means an offset; correct it in the instrument's calibration settings.
Wind speed needs one more note. A masthead sensor sits well above the 10 metre height used in weather forecasts, and wind is stronger higher up, so your masthead reading will often exceed the forecast. That's fine if you use the same sensor every time, and note its height on the first page. Compare your polar with a published one and you must allow for the difference.
Clean hull, loading and sails
Write these down at the start of every session, because a polar is only true for the state the boat was in.
- Days since the last hull scrub, and the antifouling age.
- Approximate load, for example full tanks and a holiday's stores.
- Which headsail, whether a reef was in, and the age of the sails.
- Sea state in a word.
If the hull is fouled, wait until it's clean. A dirty bottom will cost you more speed than most trim errors, and it will quietly drag down every number you collect.
Capturing the data
Choose a day of steady wind and open water. Then steer each angle on this list, on both tacks where you can.
| Wind band | True wind angles to sail |
|---|---|
| Light, 6 to 8 knots | 50, 60, 75, 90, 110, 130, 150 |
| Medium, 10 to 14 knots | 45, 50, 60, 75, 90, 110, 130, 150, 165 |
| Fresh, 16 to 20 knots | 45, 50, 60, 75, 90, 110, 130, 150, 165 |
Hold each one long enough for the boat to settle. Oppedijk's method needs at least 30 seconds per reading to be usable. In practice you get better results if you settle for a minute or two and then record two or three minutes. Log the speed through water, wind speed, wind angle and heading, plus the sail configuration. A typical grid is about nine wind angles across about seven wind speeds, so plan on several sessions.
Use speed through water, and keep SOG out of it. In a 1.5 knot tidal stream the SOG can be wrong by that same 1.5 knots, which is as big as the difference between good and bad sailing.
Filtering
Throw out any section that fails one of these tests.
- Engine on, or engine just stopped.
- Tack, gybe, reef or sail change in the section or the 30 seconds before it.
- Wind speed changing by more than about 2 knots across the section, or angle by more than 5 degrees.
- Surfing runs or wave-driven peaks that lift the speed for a few seconds.
- Heavy helm movement, or a yacht's wake.
- In tidal waters, shallow water or strong tidal shear, where the log and the true wind both lie.
Be strict. Fewer clean sections beat a large pile of mixed data.
Binning
Group the sections into angle bins 10 degrees wide, for example 85 to 95 for a nominal 90, and wind bins 2 knots wide, for example 11 to 13 for a nominal 12. Average each section first, so that one section counts as a single value. Then take the bin's values and decide what speed represents it.
Why a high percentile beats the mean and the maximum
Say, as an example, you have 12 clean sections in the 12 knot band at 90 degrees true:
6.1, 6.3, 6.4, 6.5, 6.5, 6.6, 6.7, 6.7, 6.8, 6.9, 7.0, 7.8
The mean is 6.7, which includes every section where you were distracted or badly trimmed, so it's too low for a target. The maximum, 7.8, is one surf down a wave and you'll never hold it. The 90th percentile, here the eleventh of twelve values at 7.0, is what the boat does when sailed well, and you can repeat it.
| TWA (12 kn band) | Sections | Mean | 90th percentile | Max | VMG at 90th |
|---|---|---|---|---|---|
| 45 | 7 | 5.1 | 5.4 | 5.6 | 3.8 |
| 50 | 9 | 5.6 | 5.9 | 6.1 | 3.8 |
| 55 | 8 | 5.9 | 6.2 | 6.4 | 3.6 |
| 90 | 12 | 6.7 | 7.0 | 7.8 | n/a |
| 120 | 8 | 6.4 | 6.8 | 7.2 | 3.4 |
| 150 | 5 | 5.1 | 5.5 | 6.3 | 4.8 |
All figures are invented for this example. VMG is boat speed multiplied by the cosine of the true wind angle, so at 45 degrees 5.4 times 0.707 is 3.8. Here 45 and 50 degrees are nearly equal for VMG, and 55 loses ground. With only five sections, the 150 degree line is thin; mark it as provisional.
Creating your own polar diagram by hand or from logged data
With paper or a spreadsheet, note each steady section as one row of TWA, TWS and boat speed and sort them into bins by eye. It's slow but works, and a morning's sailing gives a useful table. If you log NMEA data from your instruments, you can apply the same filters to every second of the season, and the polar fills in automatically over time. See plotter data on iPhone for getting that data.
For a first usable polar, aim for several clean sections per angle in the wind bands you sail most, perhaps a dozen good days. Expect holes at very light winds and in strong winds, because you sail those less. Leave gaps empty and let the polar show them.
Using it: VMG, routing and targets
Read the best angle upwind and downwind for each wind band; that is your target angle. Put target speeds on the chart table as a small card. In a router, load the polar and set your upwind and downwind limits, since LuckGrib notes the solver otherwise assumes the boat can sail angles it can't achieve. Treat any routing result as an estimate.
Polar diagrams in Manta
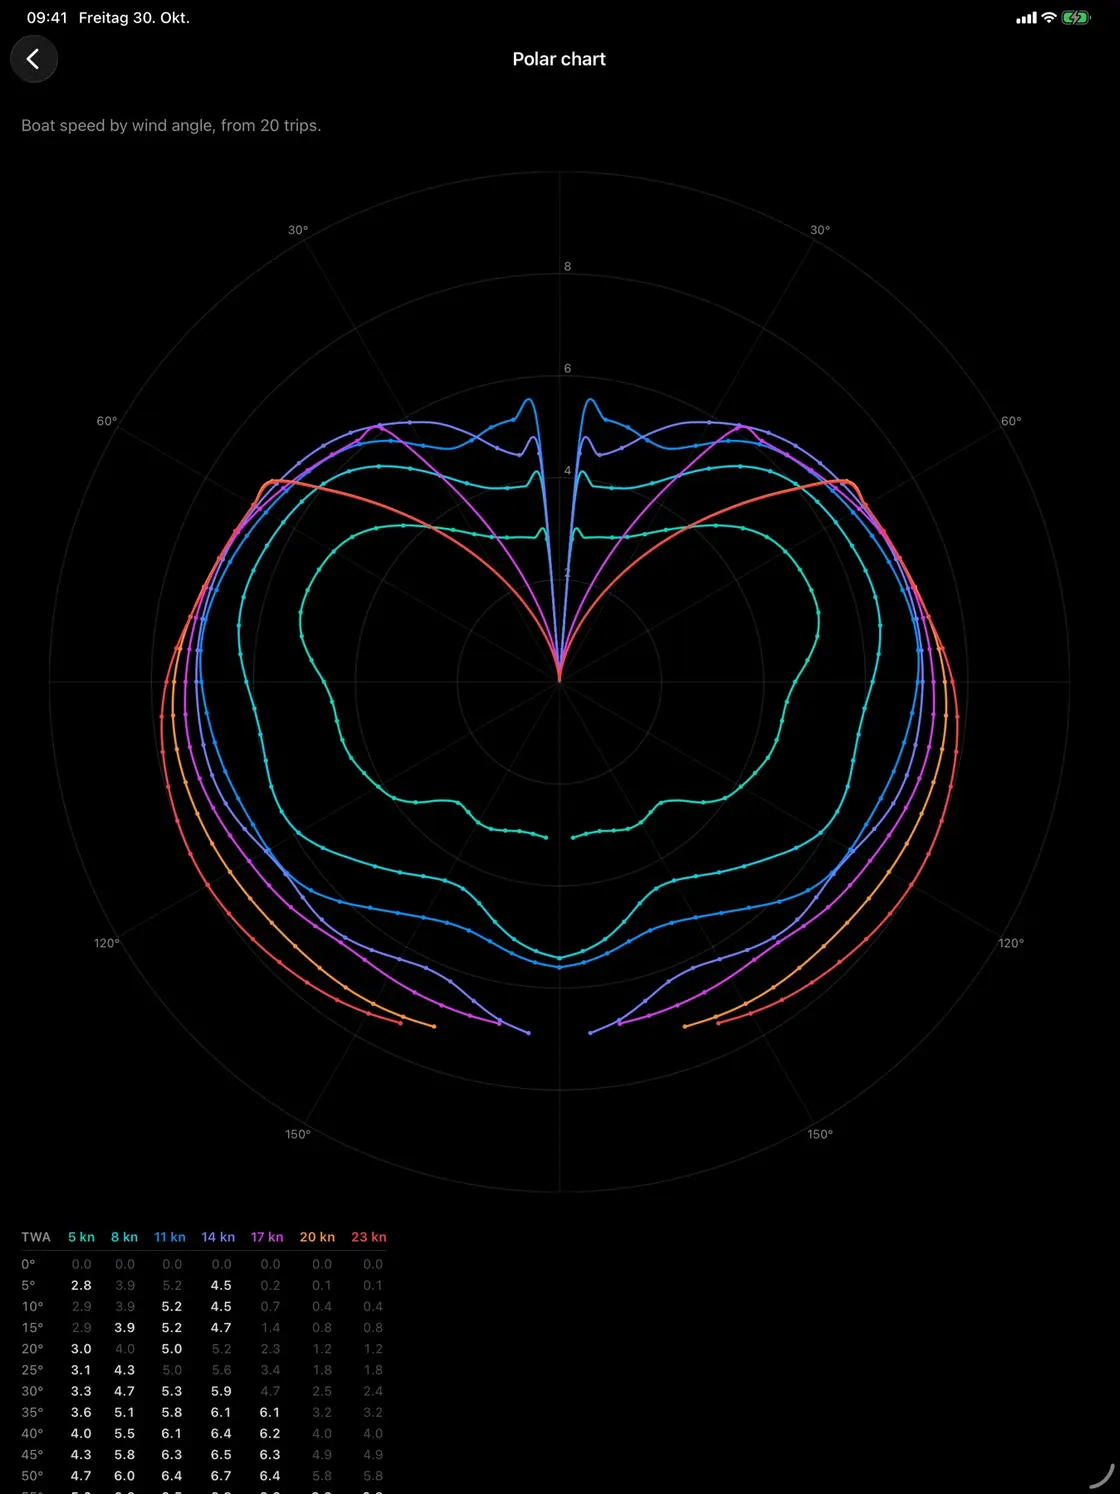
Manta builds a polar diagram (Pro) per boat from sections sailed with the engine off, using wind and speed from connected instruments, so it needs a plotter or gateway connection. Dots mark the angles you really sailed, the line between them is estimated, and the display shows how complete it is. The performance percentage uses the boat's own records: 100 percent is a realistic target, and 90 percent and above counts as well sailed.
Questions
How do I create my own polar diagram?
Calibrate boat speed and wind instruments, sail steady sections at a list of true wind angles in each wind band, throw out unsteady data, group the rest into bins, and take a high percentile of each bin as the target.
How much data do I need for a first polar?
Several steady sections per angle in the wind bands you sail most. A dozen good days under sail will usually give a usable first polar for the common wind range. Expect gaps at the extremes, which fill in over seasons.
Should I use speed through water or SOG?
Use speed through water from a calibrated log. Speed over ground includes current, so it describes the tide as much as the boat.
Why doesn't my boat match the designer's polars?
Designer polars come from a velocity prediction program assuming a clean hull, good sails and a skilled crew. Your boat has a cruising load, older sails and a real sea state, so your numbers will usually be lower.
Manta does this for you
Sailing polar diagrams from your own trips Pro
Manta builds your boat's polar diagram from the trips you sail and shows how well she performs on every point of sail.