A chart of how fast a boat sails at every wind angle and wind strength, her performance fingerprint.
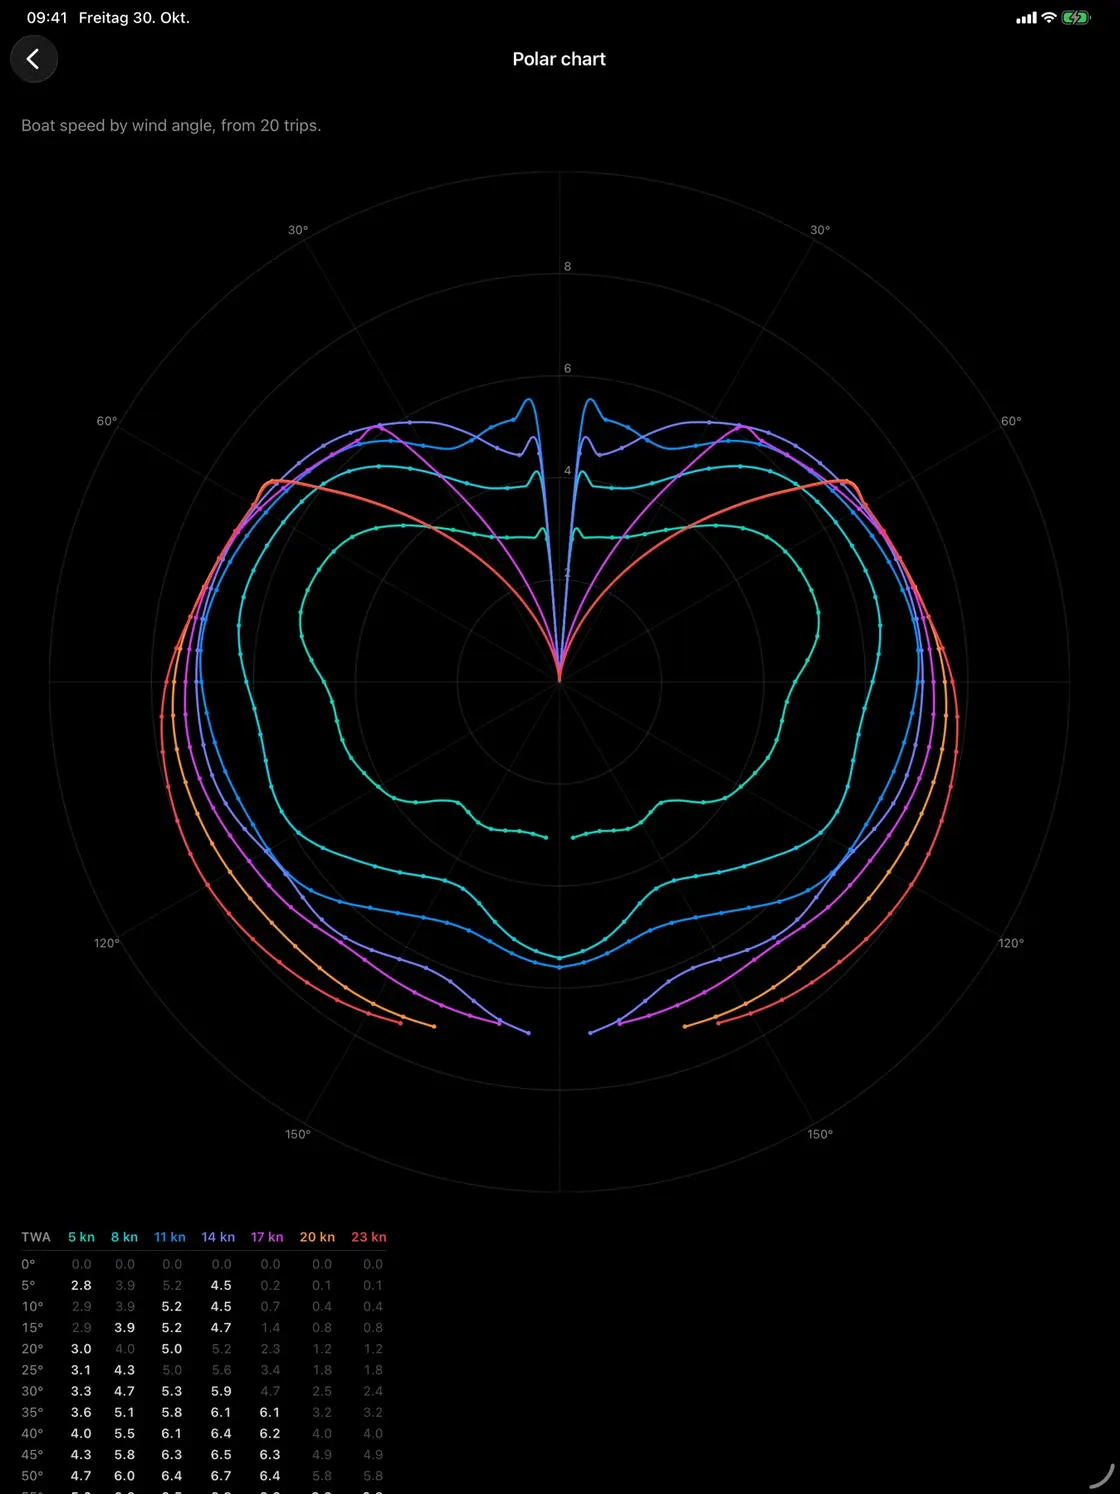
A polar diagram (or just polars) shows how fast a boat can sail at each true wind angle, for a range of true wind speeds. Each wind speed is drawn as one curve around the boat: the further a point lies from the centre, the faster she sails at that angle.
Reading it
- Angle around the centre: the true wind angle, from 0° (dead upwind) at the top to 180° (dead downwind) at the bottom. Because port and starboard behave the same, often only one half is drawn.
- Distance from the centre: speed through the water in knots.
- One curve per wind speed, for example 6, 10, 14 and 20 knots of true wind.
The point on each curve furthest forward (or aft) in the wind direction marks the best upwind (or downwind) VMG, the angle to sail when beating or running.
Where polars come from
Designers calculate them with a velocity prediction program; rating systems such as ORC publish them on the boat's certificate. Real boats with real sails, loading and crews rarely match these numbers, which is why sailors record their own. Manta builds a boat's polar diagram from the trips she sails. More in the guide reading a polar diagram.
Manta does this for you
Sailing polar diagrams from your own trips Pro
Manta builds your boat's polar diagram from the trips you sail and shows how well she performs on every point of sail.